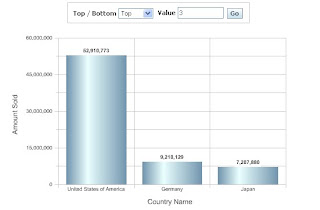
By altering the code generated with some javascript the functionality can be acheieved.
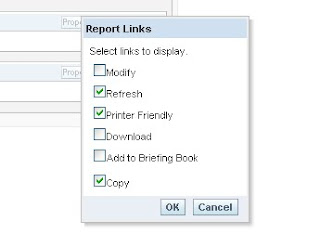
First add the Folder reports to the dashboard.
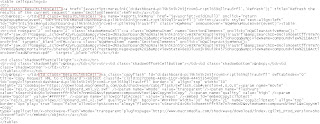
Go to page source -> search for table class "SectionTable"
Copy the code from the table start to end.
Then I added some script to add an Iframe and based on the user selection change the iframe content with the corresponding report.
Find the sample script below, with changes marked in bold.
=====================================================================================
[script]
function changeTheFrame(right)
{
parent.frames[0].location.href = right;
}
[/script]
[table class="SectionTable" cellspacing=0 style="" ]
[tr][td class="MinMaxCell" onclick="saw.dashboard.onToggleSection('d:dashboard~p:kgofk8gpr1igoom3~s:2hn4flc307gjsvb7', event); return false;" align="right"]
[!-- img id="d:dashboard~p:kgofk8gpr1igoom3~s:2hn4flc307gjsvb7Min" src="res/s_oracle10/portal/btn_min.gif" title="Collapse"/ --]
[img id="d:dashboard~p:kgofk8gpr1igoom3~s:2hn4flc307gjsvb7Max" src="res/s_oracle10/portal/btn_max.gif" style="display:none" title="Expand"/][/td][/tr]
[tr]
[td]
[table id="d:dashboard~p:kgofk8gpr1igoom3~s:2hn4flc307gjsvb7Contents" style="width:100%;"]
[!-- start folder --]
[tr height="100%"]
[td VALIGN="TOP" ALIGN="" colSpan="2" ]
[a href="javascript:void(null)" onclick="IgnoreEvent();" title="Text" name="SectionElements"]
[/a]
[a href="javascript:void(null)" onclick="IgnoreEvent();" title="Folder" name="SectionElements"]
[/a]
[table border=0 cellspacing=0]
[tr]
[td class="ExpandFolder" style="cursor:hand" onclick="javascript:ExpandCollapse('saw_89_4', event)"]
[img border=0 src="res/s_oracle10/portal/ifolder.gif"]
[a href="javascript:void(null)" onclick="javascript:ExpandCollapse('saw_89_4', event);return false" title="01 Ranking and Toppers"]
[font class="ExpandItem" onMouseover="this.className='ExpandOver';" onMouseout="this.className='ExpandItem';"]
[b]01 Ranking and Toppers[/b]
[/font]
[/a]
[/td]
[/tr]
[tr]
[td id="saw_89_4" class="_ExpandThis" style="display:none"]
[table class="ExpandList" border=0 cellpadding="0px" style="margin:0 12px;" cellspacing=0]
[tr]
[td]
[a href="javascript:changeTheFrame('http://localhost:9704/analytics/saw.dll?Go&Path=/shared/Sample%20Sales/01%20Ranking%20and%20Toppers/Multi%20Metrics%20Proportional%20Top%20Ns');" title="Multi Metrics Proportional Top Ns"]
[font class="ExpandItem" onMouseover="this.className='ExpandOver';" onMouseout="this.className='ExpandItem';"]
Multi Metrics Proportional Top Ns
[/font]
[/a]
[/td]
[/tr]
[tr]
[td]
[a href="javascript:changeTheFrame('http://localhost:9704/analytics/saw.dll?Go&Path=/shared/Sample%20Sales/01%20Ranking%20and%20Toppers/Multi-Dims%20Top%20Ns
');" title="Multi Dims Top Ns"]
[font class="ExpandItem" onMouseover="this.className='ExpandOver';" onMouseout="this.className='ExpandItem';"]
Multi Dims Top Ns
[/font]
[/a]
[/td]
[/tr]
[/table]
[/td][/tr]
[/table]
[/tr][!-- end folder --][/table]
[/td][/tr]
[/table]
[div]
[iframe FRAMEBORDER="0" BORDER=0 marginwidth=0 marginheight=0 hspace=0 vspace=0 width=1200 height=600 scrolling=auto]
[/iframe]
[/div]
=====================================================================================
Note: Change [ and ] with html tags <>
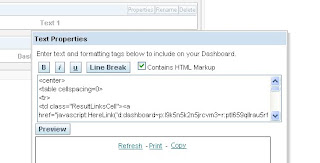
Add a text, check the checkbox for HTML and enter the code.
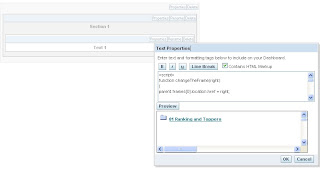
Save the dashboard,

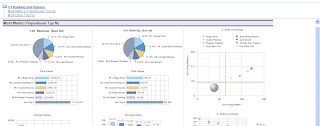
On expanding it will see the reports we added.

On selecting the report will display on the frame inside the dashboard.
Vino

