Create a prompt that will show top or bottom values to use, choose the column for the prompt and in show choose SQL results and enter the SQL,
Select Case when 1=0 Then Table1.Column Else 'Top' End From “Subject Area”
Union All
Select Case when 1=0 Then Table1.Column Else 'Bottom' End From “Subject Area”
In Default to, choose specific value and enter Top. Set the presentation variable (pv_tb).
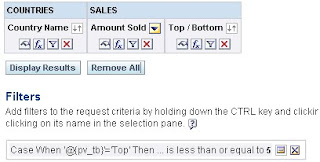
In Answers, add the columns for the request
Country Name, Amount Sold
Set the Amount Sold column as descending, to get the chart values in order.
Add a dummy column, name it as Top / Bottom in that fx enter the following,
Case When '@{pv_tb}'='Top' Then Rcount(1) Else (Max(Rcount(1))-Rcount(1)+1) End
Add a filter over this column as less than or equal to 5.

Go to dashboard add the prompt and the request.
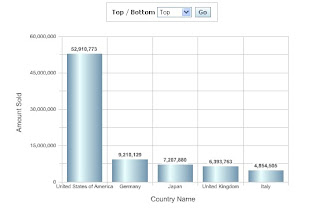
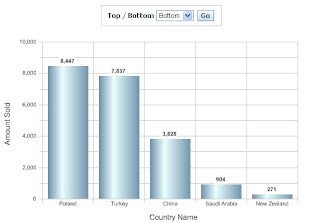
This will give Top 5 or Bottom 5 values based on the prompt selection.
Top selection:

Bottom Selection:

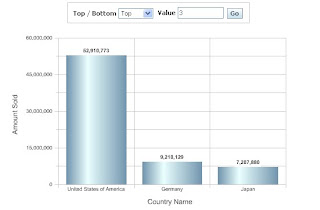
To have dynamic value to be passed for the report, change the above prompt add another column to the prompt. Make the prompt as edit box and set a specific value and set presentation variable (pv_rk) to have the value as shown below.

Now change filter condition in above criteria to add the presentation variable pv_rk as filter instead of the value 5.
The report will be,

Vino
No comments:
Post a Comment