Friday, August 5, 2011

OBIEE10g hiding Page Option for specific dashboard page / users

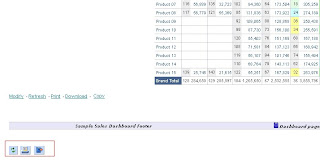
In OBIEE 10g you can hide the Page Options for all dashboard and users, by using John's blog post.

In scenarios where you want to hide the page option for a specific dasboard page or users, groups. In those cases you can use this approah.

The following javascript will hide the Page Option.

<script type="text/javascript">

function hidePageOption()
{
  var body = document.getElementsByTagName('body')[0];

  var tabcls = body.getElementsByTagName("td");

  var tablcn;

  for (i = 0; i < tabcls.length; i++)

  {

    tablcn = tabcls[i];

    if(tablcn.className=='TabLinksCell')

    {

      tablcn.style.display = "none";

    }

  }

}

hidePageOption();

</script>


Go to Page Option -> Edit Dashboard
create a separate section in Edit dashbaord layout, make sure that section is at the top of all other section.

In that add text and enter the above mentioned javascript (ensure to click on HTML markup).

To hide it for specific users/groups, go to Section Properties -> Permissions


In that add the users/groups for whom these section needs to be executed, I have given access for this section to user Vinodh. Only for this user the javascript would be executed and for all other users it will show the Page option.


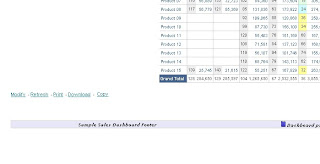
For user Vinodh the page options would be hided.


For other user it would be visible,


Vino

Tuesday, July 26, 2011

OBIEE 10g Pivot Table Row heading

In OBIEE pivot table by default the row heading would be empty. when we use measure labels as shown below


We cannot over write the row heading by default settings, to overwrite it use the following javascript.

Add a static / narrative view in the report and add the javascript.


<script language=javascript>
var arr = new Array();
function overWriteRH()
{
  var arr=document.getElementsByTagName("td");
   for (i=0; i<arr.length; i++)
   {
      if (arr[i].className=="PTRH")
      {
            arr[i].innerText="Measures";
         arr[i].textContent="Measures";  
    
      }
   }
}
overWriteRH();
</script>


Now the row heading will be avilable in the pivot table,


Change the'Measures' in the above code to the value we need to display, also we can format the font as we want using simple HTML tags.


Vino

Monday, July 25, 2011

OBIEE 10g hide Refresh, Printer Friendly and Add to Breifing Book links for specific dashboard

In OBIEE 10g links for Dashboard Refresh, Printer Friendly and Add to Breifing Book were available at bottom of the page by default.


To hide the link for a specific dashboard

Go to Edit Dashboard -> Add a Text box (enable the HTML markup), In that enter the below Java script code.


<script type="text/javascript">

onload=function hideAll()
{
   var body = document.getElementsByTagName('body')[0];
   var spns = body.getElementsByTagName("span");
   var spn;
   for (i = 0; i < spns.length; i++)
    {
      spn = spns[i];
      if(spn.className=='DashboardFormatLinks')
      {
        spn.style.display = "none";
      }
   }
}
</script>


Now the links would be hided.


Vino

Sunday, December 12, 2010

OBIEE Column Level Security with Grant Total

Two users UserA and UserB were used for this sample.

UserA belongs to Non Sales group.
The column level security is applied over Non Sales group, so users from Non Sales group cannot see the Quantity sold column.


UserB do not have any restrictions.

For UserB,


Same report for UserA,


The grant total value of Amount Sold column is displayed at the column which is hided for the UserA. Usually when we enable column level security that column will be pushed to end, that is the reason for this.

To get the correct format with same functionality.

Remove column level security from RPD Quantity Sold column from RPD presentation layer.

In logical layer go to the LTS, In column mapping write the case statement like shown below,


Now for UserA,


For UserB the report will show all values for the quantity sold column.

Vino

Sunday, December 5, 2010

OBIEE Data Level Security - Session Variables

This example is based on SH schema tables.
A new table created for storing user details.The user details where stored in a database table as shown below,


The two users used for this example are UserA and UserB.

Create the Initialization block for populating the group session variable.


This will populate the group values (REGION, PRODUCT in the GROUP session variable based on the user).

Create another session variable to populate the data value for the group.


This will populate the data value for each group based on user.
Now create two groups REGION, PRODUCT in the RPD.


Now go to Group REGION -> Permissions
Go to filter tab ->Add the logical layer table for applying the filter.


Similarly add the filter over other table as well wherever the filter needs to be applied, In this the filter applied over Sales (fact) table as well.


Add filter over the Product group as well based on the table.


Now when a user with no data level security logs in


For UserA,


For UserB,


If UserB selects the following column


Since this did not have product or region table column then also the filter will be applied because we have added the filter over the Sales table for both REGION and PRODUCT group.

The physical query for the above criteria will have this additional filter for region and products.


In the above physical SQL the filters for Region and Product is applied. Like this we can add other table also in the group to enforce the filter to be applied over the tables.

Vino

Wednesday, November 10, 2010

Refresh only particular reports in Dashboard - OBIEE

By adding html meta tag we can refresh the whole dashboard.

To refresh a particular report in the dashboard,I used the following code.
Using this I call the report inside Iframe and refresh the frame periodically.

Go to Edit dashboard -> add text and enable HTML
Enter the below code in the text box (change the report path).


[script>
function refreshTheFrame()
{
parent.frames[0].location.href='http://localhost:9704/analytics/saw.dll?Go&Path=/shared/Sample/Test_report';
}
setInterval('refreshTheFrame()',"60000");
[/script>
[div>
[iframe frameborder="0" border=0 marginwidth=0 marginheight=0 hspace=0 vspace=0 width=1200 height=600 scrolling=auto>
[/iframe>
[/div>

Note: In the code replace the [ with <
This code refreshes the report for every 1 min.


Vino

Saturday, October 16, 2010

Folder reports in same Dashboard

I saw this question @OTN OBIEE

By altering the code generated with some javascript the functionality can be acheieved.

First add the Folder reports to the dashboard.

Go to page source -> search for table class "SectionTable"
Copy the code from the table start to end.
Then I added some script to add an Iframe and based on the user selection change the iframe content with the corresponding report.

Find the sample script below, with changes marked in bold.


=====================================================================================

[script]

function changeTheFrame(right)

{

parent.frames[0].location.href = right;

}

[/script]


[table class="SectionTable" cellspacing=0 style="" ]

[tr][td class="MinMaxCell" onclick="saw.dashboard.onToggleSection('d:dashboard~p:kgofk8gpr1igoom3~s:2hn4flc307gjsvb7', event); return false;" align="right"]

[!-- img id="d:dashboard~p:kgofk8gpr1igoom3~s:2hn4flc307gjsvb7Min" src="res/s_oracle10/portal/btn_min.gif" title="Collapse"/ --]

[img id="d:dashboard~p:kgofk8gpr1igoom3~s:2hn4flc307gjsvb7Max" src="res/s_oracle10/portal/btn_max.gif" style="display:none" title="Expand"/][/td][/tr]

[tr]

[td]

[table id="d:dashboard~p:kgofk8gpr1igoom3~s:2hn4flc307gjsvb7Contents" style="width:100%;"]

[!-- start folder --]

[tr height="100%"]

[td VALIGN="TOP" ALIGN="" colSpan="2" ]

[a href="javascript:void(null)" onclick="IgnoreEvent();" title="Text" name="SectionElements"]

[/a]

[a href="javascript:void(null)" onclick="IgnoreEvent();" title="Folder" name="SectionElements"]

[/a]

[table border=0 cellspacing=0]

[tr]

[td class="ExpandFolder" style="cursor:hand" onclick="javascript:ExpandCollapse('saw_89_4', event)"]

[img border=0 src="res/s_oracle10/portal/ifolder.gif"]

[a href="javascript:void(null)" onclick="javascript:ExpandCollapse('saw_89_4', event);return false" title="01 Ranking and Toppers"]

[font class="ExpandItem" onMouseover="this.className='ExpandOver';" onMouseout="this.className='ExpandItem';"]

[b]01 Ranking and Toppers[/b]

[/font]

[/a]

[/td]

[/tr]

[tr]

[td id="saw_89_4" class="_ExpandThis" style="display:none"]

[table class="ExpandList" border=0 cellpadding="0px" style="margin:0 12px;" cellspacing=0]

[tr]

[td]

[a href="javascript:changeTheFrame('http://localhost:9704/analytics/saw.dll?Go&Path=/shared/Sample%20Sales/01%20Ranking%20and%20Toppers/Multi%20Metrics%20Proportional%20Top%20Ns');" title="Multi Metrics Proportional Top Ns"]

[font class="ExpandItem" onMouseover="this.className='ExpandOver';" onMouseout="this.className='ExpandItem';"]

Multi Metrics Proportional Top Ns

[/font]

[/a]

[/td]

[/tr]

[tr]

[td]

[a href="javascript:changeTheFrame('http://localhost:9704/analytics/saw.dll?Go&Path=/shared/Sample%20Sales/01%20Ranking%20and%20Toppers/Multi-Dims%20Top%20Ns

');" title="Multi Dims Top Ns"]


[font class="ExpandItem" onMouseover="this.className='ExpandOver';" onMouseout="this.className='ExpandItem';"]

Multi Dims Top Ns

[/font]

[/a]

[/td]

[/tr]

[/table]

[/td][/tr]

[/table]

[/tr][!-- end folder --][/table]

[/td][/tr]

[/table]

[div]

[iframe FRAMEBORDER="0" BORDER=0 marginwidth=0 marginheight=0 hspace=0 vspace=0 width=1200 height=600 scrolling=auto]

[/iframe]

[/div]


=====================================================================================


Note: Change [ and ] with html tags <>

Add a text, check the checkbox for HTML and enter the code.
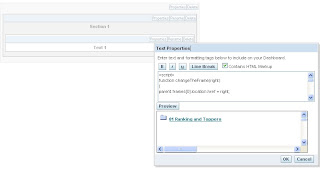


Save the dashboard,


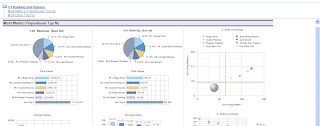
On expanding it will see the reports we added.


On selecting the report will display on the frame inside the dashboard.


Vino