Tuesday, November 1, 2016

OBIEE Extract data to Excel

After a long time starting to write blog again and I hope that I will continue….

We all know OBIEE is not a data extraction tool having said that I know how many times in real world have been asked to generate excel output from dashboard directly and especially in tabular reports which shows suppliers ,brands, products , orders or anything which go into a line item level and brings back few thousand records. These days with database and with high end servers the capability of fetching the records from backend is not an issue even with multiple parallel users but displaying in a browser is still challenge and in most of the case it is useless to display more than few hundred records.

Also I do not want the users to go in extract 100’s of thousand records from BI if that is the case there are many other best ways available. Still, I prefer to do this for <50k records with <50 columns and will give filters to get the data restricted.

I will show how we can extract records from OBIEE to excel by passing filters.

User will choose the product name and based on their selection extract will be generated for that product.


- Build original report let’s call it “Report 1” which needs to be extracted.
- Create “Report 2” that needs to be shown in the dashboard as a button and will trigger “Report 1” to be extracted to Excel.


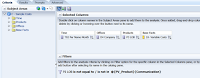
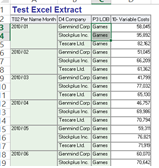
“Test Excel Extract” (Report 1) – Created with the required columns


“Test Excel Extract” (Report 2) – Created with one Dummy column which contains following GO URL formula. Go URL guides the link to the main report with the parameters mentioned in the links.


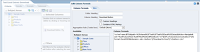
'<a href=saw.dll?Go&path=%2Fshared%2FTest%2FTest%20Excel%20Extract&Action=Navigate&col1=%22Products%22.%22P3%20%20LOB%22&val1='||'"@{PV_Product}{Communication}"'||'&Format=Excel2003&Extension=.xls><button>'||'Download to Excel'||'</button></a>'

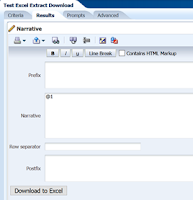
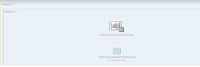
I displayed the result in direct Narrative that way by default the button will be well formatted as shown below.


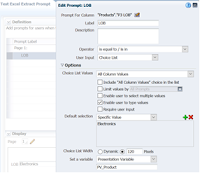
Built a dashboard prompt which can pass on the presentation variable as mentioned in the URL.


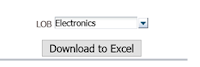
Now, in dashboard add the prompt and Report 2.


Now based on the prompt values extract will be generated.


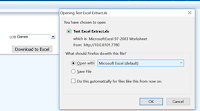
For more info on GO URL refer Oracle documentation

Friday, June 22, 2012

OBIEE - Converting Rows into Column values


This post will cover how to convert rows into columns. In OBIEE to convert rows into column I usually use user defined function and call it using Evaluate as shown here.

Oracle database 11g R2 introduced a new predefined analytic function LISTAGG, if you are in 11gR2 database you can use this function for string aggregation.

Sample dataset with department and its employees
 
Department      Employee
----------      ----------
Marketing       Michael
Marketing       Pat
Purchasing      Den
Purchasing      Alexander
Purchasing      Shelli
Purchasing      Sigal
Purchasing      Guy
Purchasing      Karen

Using listagg function we can convert this into 

Department      Employees
-----------     -------------------------------------
Marketing       Pat,Michael
Purchasing      Sigal,Shelli,Karen,Guy,Den,Alexander

In OBIEE we can useLISTAGG function using EVALUATE_AGGR

EVALUATE_AGGR('LISTAGG(%1,%2) WITHIN GROUP (ORDER BY %3 DESC)',TableName.ColumnName,',',TableName.ColumnName)


So it is doing comma separation but not returing the full value.

Just use CAST function to set the dataset length

cast(EVALUATE_AGGR('LISTAGG(%1,%2) WITHIN GROUP (ORDER BY %3 DESC)',"Department"."Employee Name",',',"Department"."Employee Name") as char(50))

Now you'll get the full value


In my case I know the size so given 50, in places we do not know the output size give some big value.

Vino

Friday, August 5, 2011

OBIEE10g hiding Page Option for specific dashboard page / users

In OBIEE 10g you can hide the Page Options for all dashboard and users, by using John's blog post.

In scenarios where you want to hide the page option for a specific dasboard page or users, groups. In those cases you can use this approah.

The following javascript will hide the Page Option.

<script type="text/javascript">

function hidePageOption()
{
  var body = document.getElementsByTagName('body')[0];

  var tabcls = body.getElementsByTagName("td");

  var tablcn;

  for (i = 0; i < tabcls.length; i++)

  {

    tablcn = tabcls[i];

    if(tablcn.className=='TabLinksCell')

    {

      tablcn.style.display = "none";

    }

  }

}

hidePageOption();

</script>


Go to Page Option -> Edit Dashboard
create a separate section in Edit dashbaord layout, make sure that section is at the top of all other section.

In that add text and enter the above mentioned javascript (ensure to click on HTML markup).

To hide it for specific users/groups, go to Section Properties -> Permissions


In that add the users/groups for whom these section needs to be executed, I have given access for this section to user Vinodh. Only for this user the javascript would be executed and for all other users it will show the Page option.


For user Vinodh the page options would be hided.


For other user it would be visible,


Vino

Tuesday, July 26, 2011

OBIEE 10g Pivot Table Row heading

In OBIEE pivot table by default the row heading would be empty. when we use measure labels as shown below


We cannot over write the row heading by default settings, to overwrite it use the following javascript.

Add a static / narrative view in the report and add the javascript.


<script language=javascript>
var arr = new Array();
function overWriteRH()
{
  var arr=document.getElementsByTagName("td");
   for (i=0; i<arr.length; i++)
   {
      if (arr[i].className=="PTRH")
      {
            arr[i].innerText="Measures";
         arr[i].textContent="Measures";  
    
      }
   }
}
overWriteRH();
</script>


Now the row heading will be avilable in the pivot table,


Change the'Measures' in the above code to the value we need to display, also we can format the font as we want using simple HTML tags.


Vino

Monday, July 25, 2011

OBIEE 10g hide Refresh, Printer Friendly and Add to Breifing Book links for specific dashboard

In OBIEE 10g links for Dashboard Refresh, Printer Friendly and Add to Breifing Book were available at bottom of the page by default.


To hide the link for a specific dashboard

Go to Edit Dashboard -> Add a Text box (enable the HTML markup), In that enter the below Java script code.


<script type="text/javascript">

onload=function hideAll()
{
   var body = document.getElementsByTagName('body')[0];
   var spns = body.getElementsByTagName("span");
   var spn;
   for (i = 0; i < spns.length; i++)
    {
      spn = spns[i];
      if(spn.className=='DashboardFormatLinks')
      {
        spn.style.display = "none";
      }
   }
}
</script>


Now the links would be hided.


Vino

Sunday, December 12, 2010

OBIEE Column Level Security with Grant Total

Two users UserA and UserB were used for this sample.

UserA belongs to Non Sales group.
The column level security is applied over Non Sales group, so users from Non Sales group cannot see the Quantity sold column.


UserB do not have any restrictions.

For UserB,


Same report for UserA,


The grant total value of Amount Sold column is displayed at the column which is hided for the UserA. Usually when we enable column level security that column will be pushed to end, that is the reason for this.

To get the correct format with same functionality.

Remove column level security from RPD Quantity Sold column from RPD presentation layer.

In logical layer go to the LTS, In column mapping write the case statement like shown below,


Now for UserA,


For UserB the report will show all values for the quantity sold column.

Vino

Sunday, December 5, 2010

OBIEE Data Level Security - Session Variables

This example is based on SH schema tables.
A new table created for storing user details.The user details where stored in a database table as shown below,


The two users used for this example are UserA and UserB.

Create the Initialization block for populating the group session variable.


This will populate the group values (REGION, PRODUCT in the GROUP session variable based on the user).

Create another session variable to populate the data value for the group.


This will populate the data value for each group based on user.
Now create two groups REGION, PRODUCT in the RPD.


Now go to Group REGION -> Permissions
Go to filter tab ->Add the logical layer table for applying the filter.


Similarly add the filter over other table as well wherever the filter needs to be applied, In this the filter applied over Sales (fact) table as well.


Add filter over the Product group as well based on the table.


Now when a user with no data level security logs in


For UserA,


For UserB,


If UserB selects the following column


Since this did not have product or region table column then also the filter will be applied because we have added the filter over the Sales table for both REGION and PRODUCT group.

The physical query for the above criteria will have this additional filter for region and products.


In the above physical SQL the filters for Region and Product is applied. Like this we can add other table also in the group to enforce the filter to be applied over the tables.

Vino