Sunday, December 12, 2010

OBIEE Column Level Security with Grant Total

Two users UserA and UserB were used for this sample.

UserA belongs to Non Sales group.
The column level security is applied over Non Sales group, so users from Non Sales group cannot see the Quantity sold column.


UserB do not have any restrictions.

For UserB,


Same report for UserA,


The grant total value of Amount Sold column is displayed at the column which is hided for the UserA. Usually when we enable column level security that column will be pushed to end, that is the reason for this.

To get the correct format with same functionality.

Remove column level security from RPD Quantity Sold column from RPD presentation layer.

In logical layer go to the LTS, In column mapping write the case statement like shown below,


Now for UserA,


For UserB the report will show all values for the quantity sold column.

Vino

Sunday, December 5, 2010

OBIEE Data Level Security - Session Variables

This example is based on SH schema tables.
A new table created for storing user details.The user details where stored in a database table as shown below,


The two users used for this example are UserA and UserB.

Create the Initialization block for populating the group session variable.


This will populate the group values (REGION, PRODUCT in the GROUP session variable based on the user).

Create another session variable to populate the data value for the group.


This will populate the data value for each group based on user.
Now create two groups REGION, PRODUCT in the RPD.


Now go to Group REGION -> Permissions
Go to filter tab ->Add the logical layer table for applying the filter.


Similarly add the filter over other table as well wherever the filter needs to be applied, In this the filter applied over Sales (fact) table as well.


Add filter over the Product group as well based on the table.


Now when a user with no data level security logs in


For UserA,


For UserB,


If UserB selects the following column


Since this did not have product or region table column then also the filter will be applied because we have added the filter over the Sales table for both REGION and PRODUCT group.

The physical query for the above criteria will have this additional filter for region and products.


In the above physical SQL the filters for Region and Product is applied. Like this we can add other table also in the group to enforce the filter to be applied over the tables.

Vino

Wednesday, November 10, 2010

Refresh only particular reports in Dashboard - OBIEE

By adding html meta tag we can refresh the whole dashboard.

To refresh a particular report in the dashboard,I used the following code.
Using this I call the report inside Iframe and refresh the frame periodically.

Go to Edit dashboard -> add text and enable HTML
Enter the below code in the text box (change the report path).


[script>
function refreshTheFrame()
{
parent.frames[0].location.href='http://localhost:9704/analytics/saw.dll?Go&Path=/shared/Sample/Test_report';
}
setInterval('refreshTheFrame()',"60000");
[/script>
[div>
[iframe frameborder="0" border=0 marginwidth=0 marginheight=0 hspace=0 vspace=0 width=1200 height=600 scrolling=auto>
[/iframe>
[/div>

Note: In the code replace the [ with <
This code refreshes the report for every 1 min.


Vino

Saturday, October 16, 2010

Folder reports in same Dashboard

I saw this question @OTN OBIEE

By altering the code generated with some javascript the functionality can be acheieved.

First add the Folder reports to the dashboard.

Go to page source -> search for table class "SectionTable"
Copy the code from the table start to end.
Then I added some script to add an Iframe and based on the user selection change the iframe content with the corresponding report.

Find the sample script below, with changes marked in bold.


=====================================================================================

[script]

function changeTheFrame(right)

{

parent.frames[0].location.href = right;

}

[/script]


[table class="SectionTable" cellspacing=0 style="" ]

[tr][td class="MinMaxCell" onclick="saw.dashboard.onToggleSection('d:dashboard~p:kgofk8gpr1igoom3~s:2hn4flc307gjsvb7', event); return false;" align="right"]

[!-- img id="d:dashboard~p:kgofk8gpr1igoom3~s:2hn4flc307gjsvb7Min" src="res/s_oracle10/portal/btn_min.gif" title="Collapse"/ --]

[img id="d:dashboard~p:kgofk8gpr1igoom3~s:2hn4flc307gjsvb7Max" src="res/s_oracle10/portal/btn_max.gif" style="display:none" title="Expand"/][/td][/tr]

[tr]

[td]

[table id="d:dashboard~p:kgofk8gpr1igoom3~s:2hn4flc307gjsvb7Contents" style="width:100%;"]

[!-- start folder --]

[tr height="100%"]

[td VALIGN="TOP" ALIGN="" colSpan="2" ]

[a href="javascript:void(null)" onclick="IgnoreEvent();" title="Text" name="SectionElements"]

[/a]

[a href="javascript:void(null)" onclick="IgnoreEvent();" title="Folder" name="SectionElements"]

[/a]

[table border=0 cellspacing=0]

[tr]

[td class="ExpandFolder" style="cursor:hand" onclick="javascript:ExpandCollapse('saw_89_4', event)"]

[img border=0 src="res/s_oracle10/portal/ifolder.gif"]

[a href="javascript:void(null)" onclick="javascript:ExpandCollapse('saw_89_4', event);return false" title="01 Ranking and Toppers"]

[font class="ExpandItem" onMouseover="this.className='ExpandOver';" onMouseout="this.className='ExpandItem';"]

[b]01 Ranking and Toppers[/b]

[/font]

[/a]

[/td]

[/tr]

[tr]

[td id="saw_89_4" class="_ExpandThis" style="display:none"]

[table class="ExpandList" border=0 cellpadding="0px" style="margin:0 12px;" cellspacing=0]

[tr]

[td]

[a href="javascript:changeTheFrame('http://localhost:9704/analytics/saw.dll?Go&Path=/shared/Sample%20Sales/01%20Ranking%20and%20Toppers/Multi%20Metrics%20Proportional%20Top%20Ns');" title="Multi Metrics Proportional Top Ns"]

[font class="ExpandItem" onMouseover="this.className='ExpandOver';" onMouseout="this.className='ExpandItem';"]

Multi Metrics Proportional Top Ns

[/font]

[/a]

[/td]

[/tr]

[tr]

[td]

[a href="javascript:changeTheFrame('http://localhost:9704/analytics/saw.dll?Go&Path=/shared/Sample%20Sales/01%20Ranking%20and%20Toppers/Multi-Dims%20Top%20Ns

');" title="Multi Dims Top Ns"]


[font class="ExpandItem" onMouseover="this.className='ExpandOver';" onMouseout="this.className='ExpandItem';"]

Multi Dims Top Ns

[/font]

[/a]

[/td]

[/tr]

[/table]

[/td][/tr]

[/table]

[/tr][!-- end folder --][/table]

[/td][/tr]

[/table]

[div]

[iframe FRAMEBORDER="0" BORDER=0 marginwidth=0 marginheight=0 hspace=0 vspace=0 width=1200 height=600 scrolling=auto]

[/iframe]

[/div]


=====================================================================================


Note: Change [ and ] with html tags <>

Add a text, check the checkbox for HTML and enter the code.
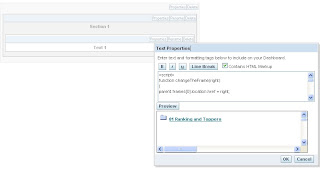


Save the dashboard,


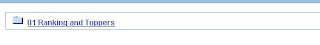
On expanding it will see the reports we added.


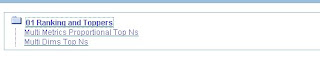
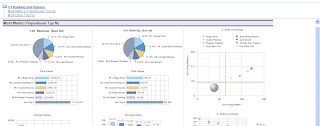
On selecting the report will display on the frame inside the dashboard.


Vino

Tuesday, October 12, 2010

Data Labels on top of pie chart

Today I saw this question @OTN OBIEE

By changing a parameter pie.pcxml we can do this.

Go to the below location,
[OracleBI_Home]\web\app\res\s_oracle10\popbin

Before doing any changes, take the backup of pie.pcxml.

In the pie.pcxml, Goto -> DataLabels tag, by default the value would be Position='OutWithLeader'
Change that attribute to, Position='Inside'

This will give,


Vino

Report Links on top of the Report

I saw this question @OTN.

To get the report links at the top of the report, I followed the following approach.

In the Edit dashboard, Go to that report properties-> Report Links -> select the links
In this case, I have selected Refresh, Printer Friendly, Copy.


Save the Dashboard, now you will get the report links at bottom of the report.


For that dashboard, On the browser View-> Pagesource

Search for ResultLinksCell, You will see three ResultLinkCell class each for Refresh,Print and Copy.
Just above the first ResultLinksCell you have table tag select the code from there copy the code upto table tag end at the third ResultLinksCell.
See the sample code selected for the above mentioned three report links,


Go to Edit Dashboard -> Add text

On the text -> Check the contains HTML Markup -> paste the copied code between center tag. The Center tag is for getting the links at center of the report as shown below.


Remove the Report links from the report properties.
Save the Dashboard.
Now you will get the report links on top,


Vino

Saturday, October 9, 2010

Top / Bottom view in the same report

To show top and bottom in the same report I followed the following approach.

Create a prompt that will show top or bottom values to use, choose the column for the prompt and in show choose SQL results and enter the SQL,

Select Case when 1=0 Then Table1.Column Else 'Top' End From “Subject Area”
Union All
Select Case when 1=0 Then Table1.Column Else 'Bottom' End From “Subject Area”

In Default to, choose specific value and enter Top. Set the presentation variable (pv_tb).

In Answers, add the columns for the request

Country Name, Amount Sold
Set the Amount Sold column as descending, to get the chart values in order.
Add a dummy column, name it as Top / Bottom in that fx enter the following,

Case When '@{pv_tb}'='Top' Then Rcount(1) Else (Max(Rcount(1))-Rcount(1)+1) End

Add a filter over this column as less than or equal to 5.


Go to dashboard add the prompt and the request.

This will give Top 5 or Bottom 5 values based on the prompt selection.

Top selection:


Bottom Selection:


To have dynamic value to be passed for the report, change the above prompt add another column to the prompt. Make the prompt as edit box and set a specific value and set presentation variable (pv_rk) to have the value as shown below.


Now change filter condition in above criteria to add the presentation variable pv_rk as filter instead of the value 5.

The report will be,


Vino

Sunday, September 26, 2010

Failed to load DLL

I installed OBIEE 10.1.3.4.1 on a new machine and when I tried to update the row count of an existing RPD, I got the following error


The error information was not clear enough, so I tried to connect to the database using sql plus.
I was able to connect with the database.
Then I tried to view the table data through RPD, I got the following error.


"[nQSError: 46029] Failed to load the DLL C:\OracleBI\server\Bin\nqsdbgatewayoci10g.dll. Check if 'Oracle OCI 10G' database client is installed."


The error seems like BI Server was not able to find the Oracle client installed on the system.
I have many Oracle homes, so went and checked the Path variable.
In the path variable , I have the Oracle client’s path was available but it was mentioned last after other Oracle applications path.


So I copied the Oracle client path and past it at the beginnig of the path variable value.


Then I closed the RPD and reopened it and I was able to connect with DB.
So changing the path helped me in solving this issue.

Other related posts
@OTN OBIEE

Sunday, July 4, 2010

Pivot table grouping and column navigation

To show the top 10 records and group the rest with (+) and others and show their total values like this,

When the users click (+) then expand the report on the same Dashboard with a scrollbar.


First create a request with 3 columns Rank (which will hold the rank), Country name and Amount_Sold Change the column (Rank) data format to accept HTML.

In the column Rank use the below formula,

In the column Country name use the below formula,

Case when RANK (sum (SALES.AMOUNT_SOLD)) <= 10 then COUNTRIES.COUNTRY_NAME else 'Others' end

Include the same dimension Country name in your request and hide this field as well. This is for OBIEE to do a proper group by in the Pivot.

Now go to the Pivot view and arrange Amount_Sold and columns updated in step no.2 and 3. However ranks will not be sorted, to do the sorting of it, Create a new dummy column and populate it by using the below formula, sort this field and then hide it.

Case when RANK(sum(SALES.AMOUNT_SOLD)) <= 10 then RANK(sum(SALES.AMOUNT_SOLD)) else 11 end

In pivot view you will get the following:

To add a scrollbar and navigation of + plus sign in the same dashboard.

Go to Dashboard add a text box, enter the following code.

Now you will see the result in a frame as below,

When you expand the ‘+’ the expanded request will be refreshed in the same page inside the Iframe


Vino