When the users click (+) then expand the report on the same Dashboard with a scrollbar.
First create a request with 3 columns Rank (which will hold the rank), Country name and Amount_Sold Change the column (Rank) data format to accept HTML.
In the column Rank use the below formula,
In the column Country name use the below formula,
Case when RANK (sum (SALES.AMOUNT_SOLD)) <= 10 then COUNTRIES.COUNTRY_NAME else 'Others' end
Include the same dimension Country name in your request and hide this field as well. This is for OBIEE to do a proper group by in the Pivot.
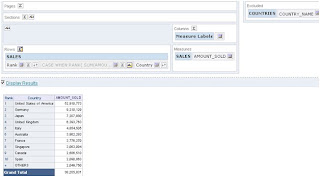
Now go to the Pivot view and arrange Amount_Sold and columns updated in step no.2 and 3. However ranks will not be sorted, to do the sorting of it, Create a new dummy column and populate it by using the below formula, sort this field and then hide it.
Case when RANK(sum(SALES.AMOUNT_SOLD)) <= 10 then RANK(sum(SALES.AMOUNT_SOLD)) else 11 end
In pivot view you will get the following:

To add a scrollbar and navigation of + plus sign in the same dashboard.
Go to Dashboard add a text box, enter the following code.
Now you will see the result in a frame as below,
When you expand the ‘+’ the expanded request will be refreshed in the same page inside the Iframe
Vino


To add a scroll bar and navigation of + plus sign in the same dashboard.
ReplyDeletesrc="http://localhost:9704/analytics/saw.dll?Go&path=/shared/web users/TEST/Test1/Plus_Link2" width ="400px" height ="300px" scrolling =yes>
I am using the same. But I did not get '+' sign how can get this?
grouping data in pivot table reports
ReplyDeletegood tips
ReplyDelete